Bem vindos ao Fórum do Portal BolsaPT! Inscrevam-se e participem na nossa comunidade, poderão pedir opiniões e Análises Técnicas às vossas acções, colocar dúvidas, aprender, partilhar ideias, ajudar outros, etc. Além das cotações, gráficos, análise técnica interactiva, históricos, terão simulação de carteiras, alarmes, e muito mais virá no futuro. Lembre-se que se pode logar com o seu login CanalForex!
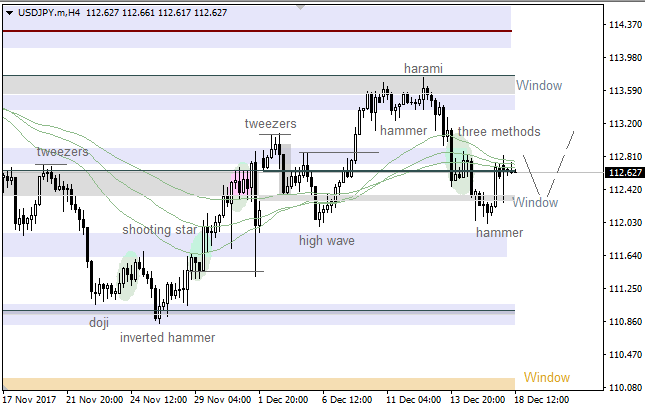
We've got a bullish "Hammer", but all the Moving Averages are acting as resistance, so the price is consolidating. So, the pair is likely going to test the lower "Window", which could be a departure point for another upward price movement.
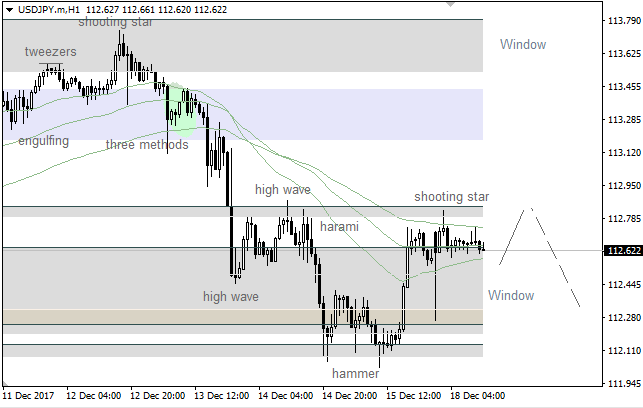
There's a bearish "Shooting Star", which has been formed on the 55 Moving Average. Therefore, the market is likely going to test the lower "Window" in the coming hours.
Wave 5 is likely going to take the form of an ending diagonal pattern. If so, there's an opportunity to have a zigzag in wave [iii] in the short term. The main intraday target is +2/8 MM Level.
There's a pullback from 0/8 MM Level, so we've got an upward impulse, which could be wave ii. Also, wave ii likely ended as a zigzag pattern, so the price is rising. Wave [1] is about to end, so if a pullback from 6/8 MM Level happens little later on, we're going to have wave [2] of iii.
BITCOIN (BTC/USD)
01:16 19.12.2017
After having found resistance at the level of 19,757, Bitcoin has made a decline of about 6%, according to the contracts of the CME Group that this week debuted as trading assets. The 50-hour moving average is exerting dynamic pressure and has caused the BTC/USD to find support at the level of 18,188.
The latest news about cryptocurrency comes from the United Kingdom, as it has been announced that the Financial Conduct Authority (FCA) will begin to monitor the different ICOs that have been appearing in recent months significantly in recent months. In addition, the speculators are taking the current movement as a breathing space for the bulls to continue taking the reins of the BTC.
The optimism in Bitcoin is still high because thanks to its launch as a trading instrument it begins to attract institutional money that helps give impetus to cryptocurrency in a long-term vision. According to the current quote, the BTC is testing the psychological level of 18,000, which could be taken as a latent corrective movement.
What do we expect?
According to our forecasts, we still do not rule out the idea that the BTC/USD is going to try again the psychological support of 18,000, taking into account that the Parabolic SAR is weakening a bit. However, it should be noted that the uptrend line drawn from the December 10 lows is helping to give dynamic support and this may cause the Bitcoin to reach the Fibonacci extension of 100% in 20,504 in the coming days.
GBP/JPY Daily Analytics
01:17 19.12.2017
GBP/JPY has been trapped in a bearish correction Since December 8th highs and now its testing the 200 SMA at H1 chart. Also, the pair has touched a demand zone established between the 50% and 65% levels at 150.18 and 149.21 respectively. If it manages to rebound above that area, the next target should be placed at the -23.6% level at 154.91.
RSI indicator remains in the neutral territory, calling for further sideways in the next hours before to make a decisive move.
On the daily chart, XAU/USD is retesting the lower border of the previous consolidation range of $1264-1298 an ounce. To return inside it, bulls need to overcome resistance at $1264-1267. On the other hand, a pullback will create grounds for the current downtrends resumption towards 200% target of AB=CD.
On H1, XAU/USD keeps retracing the current downtrend in the direction of convergence area near $1267 an ounce. A pullback will create an opportunity for short positions.
On the daily chart, USD/CAD approached the upper border of the 1.2665-1.2900 consolidation range. A break of resistance at 1.2900-1.2930 will increase the odds of advance towards 200% target of AB=CD. The pullback, on the other hand, will lead to further consolidation.
On H1, USD/CAD is forming a Widening wedge. A successful test of resistance at 1.2890-1.2905 will allow the formation of point 5. Judging by trading volumes, there are positions of large sellers near
Sell 0.7670; SL 0.7690; TP1 0.7620; TP2 0.7600.
Reason: narrowing bearish Ichimoku Cloud with falling Senkou Span A; a golden cross of Tenkan-sen and Kijun-sen, but the narrowing channel of Tenkan-Kijun; the market is under strong resistance of 0.7680.
Buy 112.60; SL 112.40; TP1 113.30; TP2 113.50.
Reason: expanding bullish Ichimoku Cloud with rising Senkou Span A; a dead cross of Tenkan-sen and Kijun-sen, but rising Tenkan-sen; the prices are supported by Senkou Span B.
BANK OF CANADA EXPECT HIGHER RATES OVER TIME
10:00 19.12.2017
The Bank of Canada left monetary unchanged at its meeting in December 2017. At the same time, the regulator allows the possibility of rate hikes at the beginning of 2018.
Bank of Canada Governor Stephen Poloz gave some hawkish comments in his recent speech. According to him, growth is seen to continue above potential, posing an upside risk to the inflation forecast. He also described the current monetary policy as quite stimulative. Such comments inspired expectations that further monetary policy tightening in Canada will come relatively soon. The probability of a rate hike in January is now estimated by 35%.
According to the Organization for Economic Cooperation and Development (OECD), Canadas growth rate will lead the G7 industrialized democracies this year at 3% before sliding to 2.1% in 2018. The nations economy was boosted by a heated housing market and increasing indebtedness of households. It seems to have some strong foundations: strong domestic demand, improving business activity and high employment.
Canadian inflation stays below the target level. Yet, the Bank of Canada seems to think that this may be explained by the impact of temporary factors, such as persistent excess capacity in the economy. As energy prices turn up, inflation will start doing so as well.
However, future economic dynamics is not without risks. Household debt reached 171.1% of income in the third quarter. The main one is the potential end of the North American Free Trade Agreement (NAFTA). The US has threatened to pull out of it unless Canada and Mexico agree to major concessions. If it happens, the Canadian dollar would greatly suffer, as 75% of Canadian export goes to the United States. In addition, tighter mortgage rules will start acting in January and its yet to be seen how the economy reacts to the two rate hikes of 2017.
Given the unusual factors at play, the bank is monitoring these risks in real time the term we use for this is data dependent rather than taking a mechanical approach to policy setting, Poloz said.
It was a volatile year for USD/CAD. The pair initially strengthened to almost 1.3800 in April, but then fell to 1.2060 in September. In the final months of 2017, the Canadian dollar has once again been weakening, so USD/CAD managed to rise to 1.2800.
There's a "V-Bottom", so the price is rising. The main intraday target is the next resistance at 1.1833 - 1.1847. If a pullback from this area happens, there'll be an opportunity to have a decline towards the next support at 1.1772 - 1.1756.
The Moving Averages have acted as support, so there's an upward price movement, which is taking place on the one-hour chart. It's likely that bulls are going to test the closest support at 1.3369 - 1.3336.