Bem vindos ao Fórum do Portal BolsaPT! Inscrevam-se e participem na nossa comunidade, poderão pedir opiniões e Análises Técnicas às vossas acções, colocar dúvidas, aprender, partilhar ideias, ajudar outros, etc. Além das cotações, gráficos, análise técnica interactiva, históricos, terão simulação de carteiras, alarmes, e muito mais virá no futuro. Lembre-se que se pode logar com o seu login CanalForex!
The price reached the nearest support, so we could have a reversal bullish pattern soon. If so, the price is likely going to test the closes resistance level, which could be a departure point for another decline.
We've got a bullish "Harami" at the local low. Considering confirmation of this pattern, the market is likely going to test the next resistance level during the day. If any bearish pattern arrives little later on, we'll likely have just another decline.
The 89 Moving Average is acting as support, so we've got a bullish "Hammer" on this line. Therefore, the pair is likely going to test the 34 MA, which could act as resistance.
There's a bullish "Hammer", so the market is likely going to test the Moving Averages in the coming hours. If a pullback from these lines happens, there'll be an opportunity to have a new local low.
EUR/USD: WAVE [II] ENDED LIKE A ZIGZAG
15:43 16.10.2017
There's a pullback from 1/8 MM Level, so wave [ii] may have been formed. So, we're likely going to have another upward price movement. The main target for wave [iii] is 6/8 MM Level.
Wave [ii] ended like a zigzag, so the price is rising. 2/8 MM Level has acted as support. In this case, we could have wave (i) in the coming hours and wave (ii) little later on.
EUR/USD: EURO RETURNED TO SENKOU SPAN A
06:02 17.10.2017
Technical levels: support 1.1770, 1.1730; resistance 1.1825.
Trade recommendations:
Buy 1.1730; SL 1.1710; TP1 1.1800; TP2 1.1825
Reason: bearish Ichimoku Cloud wit falling Senkou Span A; a new weak dead cross of Tenkan-sen and Kijun-sen with horizontal lines; the prices are breakdown the Kijuns support and going to bottom border of a Cloud.
GBP/USD: POUND SUPPORTED BY KIJUN-SEN
06:03 17.10.2017
Technical levels: support 1.3230; resistance 1.3340.
Trade recommendations:
Buy 1.3230; SL 1.3210; TP1 1.3340; TP2 1.3375.
Reason: bearish Ichimoku Cloud with horizontal Senkou Span A and B; a new golden cross of Tenkan-sen and Kijun-sen, but the lines are horizontal; the prices are returned to Kijun-sen in a correctional movement.
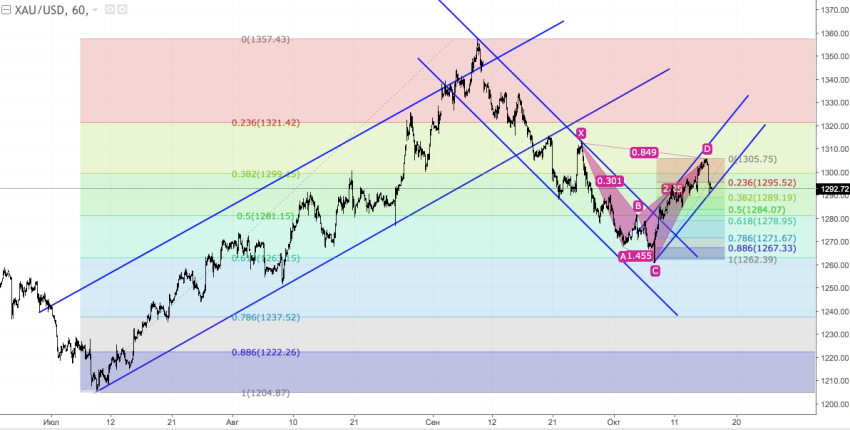
XAU/USD: GOLD IS FALLING INTO ABYSS
07:14 17.10.2017
Recommendation:
SELL $1267
SL 1282
TP1 $1237 TP2 $1222 TP3 $1212
On the daily chart, the inability of bulls to overcome resistance at $1299-1302 an ounce points at their weakness. If sellers manage to trigger AB=CD, risks of continuation towards the 200% target will significantly increase.
On H1, gold is correcting as the Shark pattern is transforming into 5-0. If bears want to return the quotes to support levels at 78.6% and 88.6% and conquer them, the continuation of the downtrend will become a reality.
USD/CAD: BULLS ARE READY FOR NEW HIGHS
07:45 17.10.2017
Recommendation:
BUY 1.256
SL 1.2505
TP1 1.2715 TP2 1.292 TP3 1.324
On the daily chart, bulls are trying to restore the short-term uptrend. They managed to defend their fortress near 1.2460. Now buyers are counting on growth towards 88.6% target of the inverted Shark pattern.
On H1, USD/CAD formed a Spike and ledge pattern. The pairs trading within the consolidation range of a ledge (1.2435-1.2560). A break of its upper border will strengthen the case for the uptrend to resume.
The last "Double Top" pattern led to the current decline. The main intraday target is the nearest support at 1.1745 - 1.1719. If we see a pullback from this area, there'll be an opportunity to have an upward price movement towards the closest resistance at 1.1822 - 1.1837.
There's a "Double Top" pattern, which has been formed under the Moving Averages. In this case, the market is likely going to test the next support at 1.1761 - 1.1738. If a pullback from these levels happens little later on, we could have an upward correction in the direction of the 34 Moving Average.
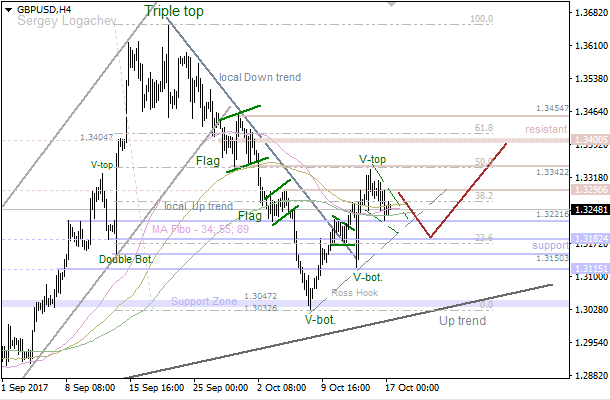
We've got a local "V-Top", so the price is consolidating. Also, there's a possible "Pennant" pattern, so the pair is likely going to test another support at 1.3221 - 1.3150. Meanwhile, if we have a pullback from these levels, there'll be an opportunity to have a bullish price movement towards the closest resistance at 1.3342 - 1.3400.
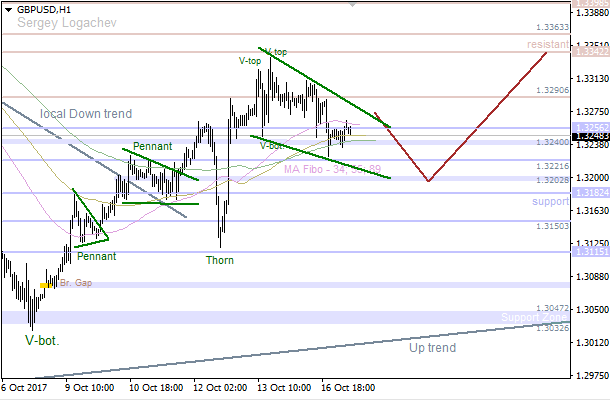
The price is still consolidating. Also, there's a possible developing "Pennant" pattern. Therefore, bears are likely going to test the nearest support at 1.3221 - 1.3202. If a pullback from this area happens, we should keep an eye on the nearest resistance at 1.3290 - 1.3342 as an intraday target.
The price is still declining, which means we should keep an eye on 0/8 MM Level as the nearest bearish target. If a pullback from this level happens, there'll be an opportunity to have another upward impulse in wave [iii].
There's a developing wave [ii], which hasn't been finished yet, so an impulse in wave (c) is likely going to be continued. The main intraday target is 0/8 MM Level, which could be a departure point for wave (i) of [iii].