Bem vindos ao Fórum do Portal BolsaPT! Inscrevam-se e participem na nossa comunidade, poderão pedir opiniões e Análises Técnicas às vossas acções, colocar dúvidas, aprender, partilhar ideias, ajudar outros, etc. Além das cotações, gráficos, análise técnica interactiva, históricos, terão simulação de carteiras, alarmes, e muito mais virá no futuro. Lembre-se que se pode logar com o seu login CanalForex!
Technical levels: support 1.3060, 1.3000; resistance 1.3150.
Trade recommendations:
Sell 1.3150; SL 1.3170; TP1 1.3060; TP2 1.3000.
Reason: bearish Ichimoku Cloud with falling Senkou Span A; a new dead cross of Tenkan-sen and Kijun-sen, falling Tenkan-sen; the prices are tested the support of 1.3020 and returned to Kijun-sen.
On the daily chart, NZD/USD keeps forming Gartley pattern. Its 78.6% target is near the lower border of the uptrend channel. This increases the risks of a pullback. After that, buyers may try to resume the uptrend.
On H1, theres the short-term downtrend. The nearest resistance is close to 0.7145. The inability of bulls to overcome it will signal buyers weakness.
On the daily chart, AUD/USD keeps going to 161.8% and 88.6% targets of the junior Crab pattern and the senior Shark pattern. They are situated around 0.76. The trend remains descending, so the pullbacks may be used for selling.
On H1, AUD/USD can trigger the inverted Shark pattern and correct towards its target at 88.6%. To do this, bears need to break the diagonal resistance in the form of the upper border of the downtrend channel.
There's a "Thorn" pattern, which pushed the price higher, but bulls faced with resistance at 1.1739. In this case, the market is likely going to test the nearest support at 1.1688, which could be a departure point for an upward price movement towards the next resistance at 1.1772 - 1.1793.
The price is consolidating near the 55 Moving Average. Also, there's a local "Triple Top" pattern, so bears are likely going to reach the closest support at 1.1695 - 1.1688. If a pullback from this area happens, there'll be an opportunity to have an upward price movement in the direction of another resistance at 1.1772 - 1.1793.
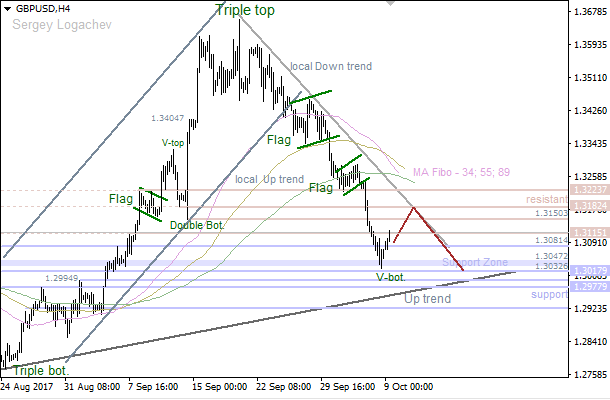
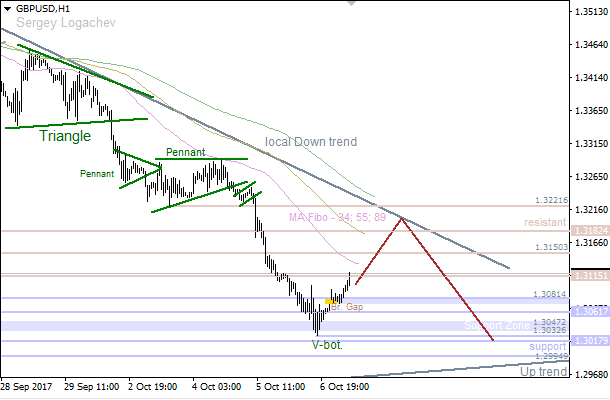
Bears faced with support at 1.3017, so we've got a "V-Bottom" pattern. In this case, the pair is likely going to achieve the nearest resistance at 1.3182 in the short term. However, if we have a pullback from this level, there'll be an option to have another decline towards the closest support area at 1.3017 - 1.2994.
The price has been rising since a "V-Bottom" pattern was formed. The main intraday target is the nearest resistance at 1.3182 - 1.3221. Meanwhile, if we see a pullback from these levels, bears will probably try to reach the next support at 1.3017 - 1.2994 soon.
EUR/USD: ANOTHER PULLBACK FROM 0/8 MM LEVEL
10:00 09.10.2017
There's another pullback from 0/8 MM Level, so wave 4 may have been formed. Also, we've got a possible ending diagonal in wave [c] of 4. In this case, bulls are likely going to deliver an impulse in wave [i]. The main intraday target is 2/8 MM Level.
-1/8 MM Level has acted as support, so we've got an upward impulse in wave (i). Moreover, wave (ii) is likely ended, so there's an opportunity to have another bullish impulse in wave (iii) of [iii] during the day.
USD/JPY: "TWEEZERS" AND "ENGULFING" PATTERNS
11:56 09.10.2017
We've got a "Tweezers" and an "Engulfing" patterns, which both have been formed at the local high. So, the 34 Moving Average is likely going to act as support soon. If a pullback from this line happens, we could have another bullish rally.
The price is still consolidating, cause the 144 Moving Average is acting as support. In this case, the pair is likely going to test the upper "Window", which could be a departure point for another decline.
There's a "High Wave" pattern, which has been confirmed. So, the market is likely going to test the 34 Moving Average, which could be a departure point for another decline.
We've got a local bullish "High Wave", so there's an opportunity to have an intraday upward price movement. The main target for buyers is the 144 Moving Average line.
AUD/USD: AUSSIE IN CORRECTION TO KIJUN
04:56 10.10.2017
Technical levels: support 0.7760; resistance 0.7800
Trade recommendations:
Sell 0.7800; SL 0.7820; TP1 0.7760; TP2 0.7715.
Reason: expanding bearish Ichimoku Cloud, falling Senkou Span A; a dead cross of Tenkan-sen and Kijun-sen, falling Tenkan-sen and Kijun-sen; the prices are in correction inside of the channel Tenkan-Kijun.
USD/JPY: DOLLAR ENTERED INTO CLOUD
04:57 10.10.2017
Technical levels: support 112.40; resistance 113.30.
Trade recommendations:
Sell 112.30; SL 112.50; TP1 111.90; TP2 111.60.
Reason: bullish Ichimoku Cloud with rising Senkou Span B, but horizontal Senkou Span A; a cancelled golden cross of Tenkan-sen and Kijun-sen, with horizontal Tenkan-sen and Kijun-sen; the prices are breaking down the SSAs support and entered into the Cloud.