Bem vindos ao Fórum do Portal BolsaPT! Inscrevam-se e participem na nossa comunidade, poderão pedir opiniões e Análises Técnicas às vossas acções, colocar dúvidas, aprender, partilhar ideias, ajudar outros, etc. Além das cotações, gráficos, análise técnica interactiva, históricos, terão simulação de carteiras, alarmes, e muito mais virá no futuro. Lembre-se que se pode logar com o seu login CanalForex!
We've got a "V-Bottom", so there's an opportunity to have a local bullish correction. Meanwhile, bears are likely going to test the next support at 1.3182 - 1.3150 afterwards. If we have a pullback from this area, bulls will probably try to deliver an upward price movement.
There's a "Double Bottom", which has been confirmed. So, the main intraday target is the nearest resistance at 1.3328. However, if a pullback from this level happens, we could have another decline.
There's a bullish "Engulfing", which has been formed at the last local low. Considering confirmation of this pattern, the market is likely going to test the Moving Averages. If a pullback from these lines happens, we could have another decline.
We've got a "Tower" and a "Doji", so the 34 Moving Average is likely going to act as resistance. So, there's an opportunity to have a local correction if a pullback from this line happens in the coming hours.
USD/JPY: "WINDOW" ACTING AS SUPPORT
12:27 03.10.2017
The nearest "Window" is acting as support, which is likely going to be tested once again in the short term. If we have another pullback from the "Window", bulls will probably try to deliver a new local high.
We've got a bearish "Tower", which has been formed right below the upper "Window". So, the pair is likely going to test the 89 Moving Average during the day.
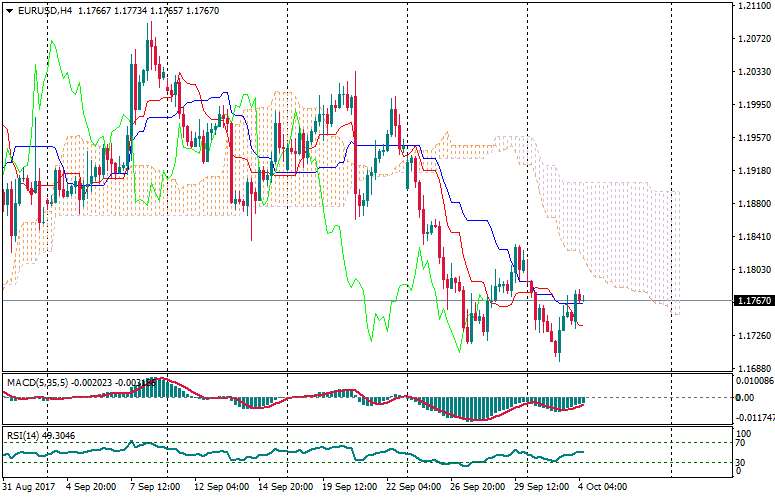
EUR/USD: EURO CORRECTED TO KIJUN-SEN
05:41 04.10.2017
Technical levels: support 1.1700; resistance 1.1770.
Trade recommendations:
Sell 1.1750; SL 1.1770; TP1 1.1700; TP2 1.1650
Reason: expanding bearish Ichimoku Cloud, falling Senkou Span A; a new dead cross of Tenkan-sen and Kijun-sen with falling Kijun-sen; the prices are under the Clouds resistance.
USD/JPY: DOLLAR WILL TEST CLOUDS SUPPORT
05:41 04.10.2017
Technical levels: support 112.30/40; resistance 113.00, 113.30.
Trade recommendations:
Buy 112.60; SL 112.40; TP1 113.30; TP2 114.00.
Reason: bullish Ichimoku Cloud with rising Senkou Span A; a golden cross of Tenkan-sen and Kijun-sen, but the horizontal Tenkan-sen and Kijun-sen; the prices are breaking down the Kijuns support and going to Cloud.
SELL 0.971 SL 0.9765 TP1 0.9585 TP2 0.954
SELL 0.9645 SL 0.97 TP1 0.9585 TP2 0.954
On the daily chart, the inability of bulls to settle above 0.9760 points at their weakness. If bears manage to use the pin bar, the odds of decline to 88.6% and 113% targets of the Shark pattern will increase.
On H1, theres a combination of reversal patterns Three Indians and Widening wedge. Aggressive selling involves opening positions on the break of the lower border of the uptrend channel. Conservative sellers can open positions on a successful break of support at 0.9645.
On the daily chart, after GBP/USD formed AB=CD and Three Indians patterns, there was a pullback. Bulls are currently trying to return in the game and resume the uptrend. For a start, they have to overcome 1.3290.
On H1, GBP/USD reached 88.6% target of the Shark pattern. After this, the Shark started transforming into 5-0. Pullbacks towards 23.6%, 38.2% and 50% of the wave CD, as usual, are used for forming short positions.
EUR/USD: "PENNANT" LED TO FORM NEW HIGH
08:58 04.10.2017
There's a "V-Bottom" pattern, so the price reached the nearest resistance at 1.1772. Nevertheless, the market is likely going to achieve the 89 Moving Average in the short term. If a pullback from this line happens, we could have a decline towards the closest support at 1.1714 - 1.1688
The last "Pennant" pattern led to form a new local high. Also, we've got a bullish "Flag", so the pair is likely going to reach another resistance at 1.1831 in the coming hours. However, if a pullback from this level happens, there'll be an opportunity to have a decline in the direction of the nearest support at 1.1739 - 1.1714.
Bears faced with support at 1.3223, so there's a "Triple Bottom", which pushed the price to the closest resistance at 1.3278. Meanwhile, the market is likely going to continue moving up towards the 34 Moving Average. If this line acts as resistance little later on, bears will try to reach another support at 1.3223 - 1.3182.
We've got a "Triple Bottom", so the price is consolidating. The main intraday target is the 89 Moving Average, which could be a departure point for another decline in the direction of the last low.
EUR/USD: POSSIBLE EXTENSION IN THE THIRD WAVE
10:27 04.10.2017
There's a pullback from 0/8 MM Level, so wave 4 may have been formed. Therefore, there's an opportunity to have an upward impulse in wave [i]. The main intraday target is 2/8 MM Level, which could be a departure point for a downward correction.
As we can see on the one-hour chart, there's a possible extension in the third wave inside wave [i]. So, the market is likely going to continue moving up, which means we could have a new local high pretty soon.