Bem vindos ao Fórum do Portal BolsaPT! Inscrevam-se e participem na nossa comunidade, poderão pedir opiniões e Análises Técnicas às vossas acções, colocar dúvidas, aprender, partilhar ideias, ajudar outros, etc. Além das cotações, gráficos, análise técnica interactiva, históricos, terão simulação de carteiras, alarmes, e muito mais virá no futuro. Lembre-se que se pode logar com o seu login CanalForex!
Technical levels: support 0.7830; resistance 0.7900, 0.7940.
Trade recommendations:
Buy 0.7830; SL 0.7810; TP1 0.7900; TP3 0.7870.
Reason: expanding bearish Ichimoku Cloud with falling Senkou Span A and B; a dead cross of Tenkan-sen and Kijun-sen; the prices are in the oversold area; strong support on 0.7830.
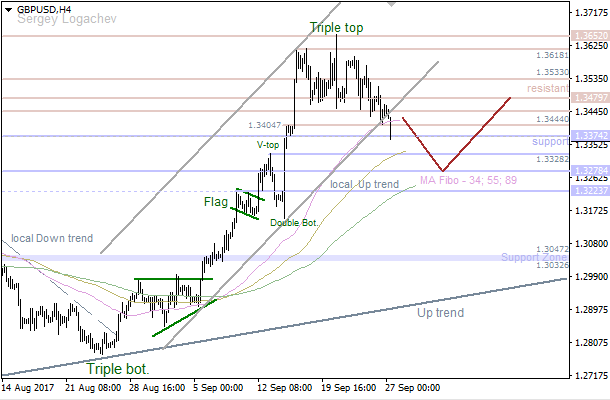
GBP/USD: POUND IS FLIRTING WITH INDIANS
07:23 27.09.2017
Recommendations:
SELL 1.34 SL 1.3455 TP 1.3325 TP2 1.322
BUY 1.356 SL 1.3505 TP1 1.356 TP2 1.375
On the daily chart, GBP/USD keeps forming Three Indians pattern. A successful test of support at 1.3400 will allow bears to develop correction. Never the less, pound is in the clear bullish trend, so targets of shorts should be moderate.
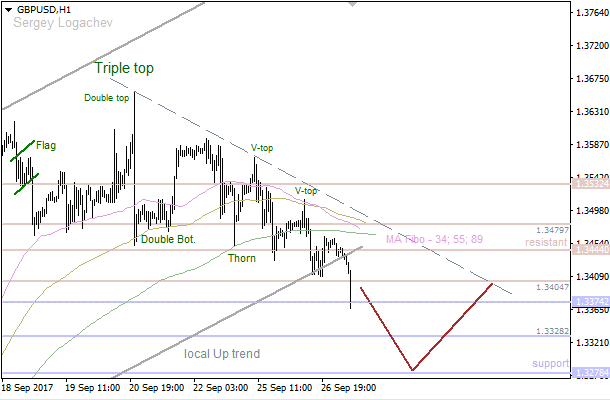
On H1, a repeated test of support at 1.34 will increase the odds of realization of 88.6% target of the Shark pattern. Return of the price to the middle of the 1.3465-1.3610 consolidation range will trigger Shakeout-Fakeout pattern and create grounds for resumption of the bullish trend.
Bears went through support at 1.1772, so we should keep an eye on the next support at 1.1714 - 1.1688 as the next intraday target. If a pullback from this area happens, we could have an upward correction towards the nearest resistance at 1.1772 - 1.1793.
The last "Pennant" pattern has been broken, so the price is declining. The main target is the closest support area at 1.1714 - 1.1688, which could be a departure point for a bullish correction.
GBP/USD: BEARS GOING TO TEST ANOTHER SUPPORT
08:34 27.09.2017
The local uptrend has been broken, so the pair is likely going to decline in the direction of the next support at 1.3328 - 1.3278. However, if we have a pullback from these levels, there'll be an opportunity to have an upward correction towards the nearest resistance at 1.3444 - 1.3479.
The pair faced with resistance at 1.3374, so bears are likely going to test another support at 1.3328 - 1.3278 during the day. If we have a pullback from this area, bulls will probably try to test the closest resistance at 1.3404.
We've got a bearish "Three Methods" pattern, so the price is declining. There isn't any reversal pattern so far, which means bears are likely going to push the price even lower in the short term.
There's a bullish "Harami", but this pattern remains unconfirmed. Therefore, we could have just a local upward correction. If a pullback from the nearest resistance happens little later on, bears will try to deliver a new local low.
USD/JPY: PAIR GOING TO CONTINUE MOVING UP
12:48 27.09.2017
The last "Window" has been broken, so we don't have any reversal pattern so far. In this case, the pair is likely going to continue moving up towards the next resistance level.
We've got a bearish "Harami", which hasn't been confirmed yet. So, there's an opportunity to have a local correction during the day. However, bulls will try to deliver a new local high afterwards.
EUR/USD: PRICE ACHIEVED 0/8 MM LEVEL
13:33 27.09.2017
The price is still declining. It seems like wave 4 is taking the form of a zigzag, which is about to end. So, if a pullback from 0/8 MM Level happens later on, there'll be an opportunity to have wave [i] of 5.
The pair has achieved 0/8 MM Level, which could act as support. If so, bulls are likely going to deliver wave [i]. The main intraday target is 2/8 MM Level.
EUR/JPY: BEARS ARE LOSING POWER
07:10 28.09.2017
Recommendation:
BUY 133.05
SL 132.5
TP1 134.45 TP2 135.5
On the daily chart, after EUR/JPY reached 161.8% target of AB=CD and corrected, it rebounded from the key support level at 132.05. Bulls are trying to use pin bar and resume the uptrend.
On H1, EUR/JPY formed a Widening wedge and broke below the diagonal support in the lower part of the trade channel. To resume the uptrend, bulls will need to return the pair inside the trend channel. To do this, they should get above resistance at 133.05.
On the daily chart, USD/JPY approached 88.6% target of the inverted Shark pattern. If they succeed to keep the pair above 113, the pair may go for 113% target.
On H1, USD/JPY keeps rising towards 224% target of AB=CD. The nearest resistance is close to 113.65. A recoil down from this level is likely. Trend remains bullish, so correction with the following recoil to the downside may be used for buying.
Technical levels: support 1.1725; resistance 1.1800, 1.1875.
Trade recommendations:
Buy 1.1725; SL 1.1700; TP1 1.1800; TP2 1.1825.
Reason: bearish Ichimoku Cloud with falling Senkou Span A; a dead cross of Tenkan-sen and Kijun-sen, falling lines; the market is oversold and the prices on the main daily support of the Cloud.