Bem vindos ao Fórum do Portal BolsaPT! Inscrevam-se e participem na nossa comunidade, poderão pedir opiniões e Análises Técnicas às vossas acções, colocar dúvidas, aprender, partilhar ideias, ajudar outros, etc. Além das cotações, gráficos, análise técnica interactiva, históricos, terão simulação de carteiras, alarmes, e muito mais virá no futuro. Lembre-se que se pode logar com o seu login CanalForex!
We've got a bearish "Harami", but the last "Window" remains open. So, the market is likely going to continue declining towards the nearest support. If any bullish pattern arrives later on, we could have an upward correction.
The price reached the "Window", but there isn't any reversal pattern so far. Therefore, we could have just a local upward correction and a decline afterwards
The upper "Window" has acted as resistance once again, so we've got a "Shooting Star". In this case, the market is likely going to test the nearest "Window", which could act as support.
We've got a "Hammer", which has been formed on the 34 Moving Average. So, bulls are likely going to test the closest "Window", which could be a departure point for a decline.
Technical levels: support 1.1800, 1.1725; resistance 1.1875.
Trade recommendations:
Buy 1.1800; SL 1.1780; TP1 1.1850; TP2 1.1875.
Reason: bearish Ichimoku Cloud with falling Senkou Span A; a new dead cross of Tenkan-sen and Kijun-sen with falling lines; the prices are entered into the negative area, but there is a strong support on 1.1800 and the market is oversold.
USD/JPY: DOLLAR IS IN CORRECTION TO CLOUD
07:30 26.09.2017
Technical levels: support 111.40, 111.10; resistance 111.90, 112.20.
Trade recommendations:
Buy 111.40; SL 111.20; TP1 111.90; TP2 112.20.
Reason: bullish Ichimoku Cloud, but horizontal Senkou Span A and B; a golden cross of Tenkan-sen and Kijun-sen with narrow channel Tenkan-Kijun; the prices are breaking down the Kijuns support and in correction local trend to the Cloud.
EUR/USD: BEARS FACED WITH SUPPORT
07:59 26.09.2017
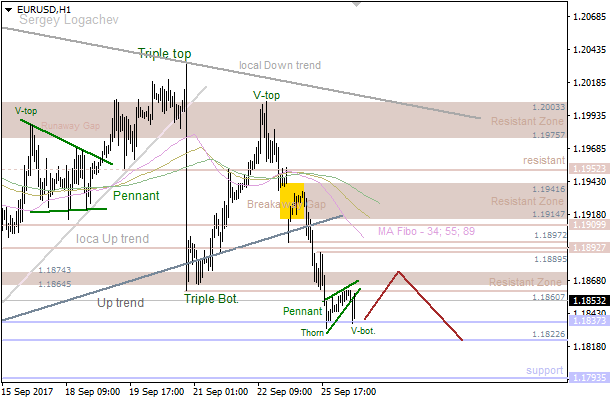
The 89 Moving Average has been broken, so there's a new local low. In this case, the market is likely going to continue declining towards the nearest support at 1.1837 - 1.1822. If a pullback from this area happens, we could have an upward correction in the direction of the closest resistance at 1.1925 - 1.1952.
Bears faced with support at 1.1837, so the price is consolidating. Therefore, we should keep an eye on the nearest resistance at 1.1864 - 1.1874 as an intraday target. Meanwhile, if we have a pullback from these levels, bears will probably try to catch another support at 1.1837 - 1.1822.
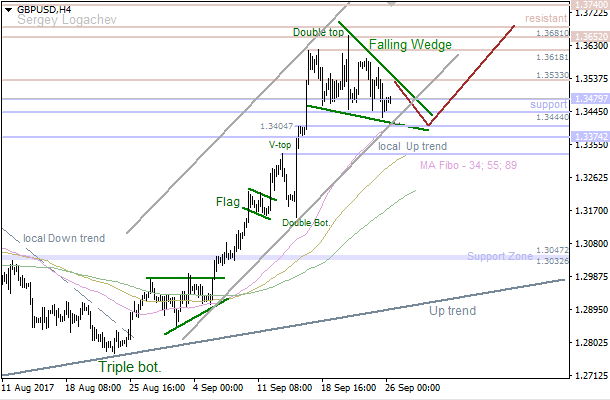
The price is consolidating between the levels. Also, there's a bullish "Wedge" pattern, so the pair is likely going to test the nearest support at 1.3444 - 1.3404. If a pullback from this target happens, there'll be an opportunity to have an upward price movement in the direction of the next resistance at 1.3625 - 1.3681.
The 89 Moving Average has acted as support, so we could have a local upward correction. However, if the 34 MA acts as resistance, bears are likely going to reach another support at 1.3404 afterwards.
EUR/USD: BEARISH "HARAMI" LED TO DECLINE
12:19 26.09.2017
The last bearish "Harami" led to a decline. Also, there's a "Three Methods" pattern, so the market is likely going to continue falling down towards the nearest support area in the short term.
There isn't any reversal pattern so far, but we could have a local upward correction. Anyway, bears are likely going to push the price even lower afterwards.
There are a "Shooting Star" and a "Harami" patterns, which both have been confirmed. So, we should keep an eye on the 55 Moving Average as an intraday target.
The 89 Moving Average has acted as support, so we've got a bullish "High Wave" pattern on this line. In this case, the pair is likely going to test the 34 MA, which could be a departure point for another decline.
USD/CHF: FRANC HAS DRAWN A TRIANGLE
07:09 27.09.2017
Recommendation:
BUY 0.9745 SL 0.969
TP 0.9845, SELL 0.965
SL 0.9705 TP 0.9585
On the daily chart, USD/CHF keeps forming the Dragon pattern. Renewal of September high will allow to expect process growth towards the curl of the Dragons tail and the upper border of the descending trend channel.
On H1, USD/CHF formed a triangle. A successful test of its upper border and resistance at 0.9745 will increase the odds of the rallys continuation. On the other hand, a break below the triangles lower border, the uptrend channel, and support at 0.9650 will trigger a correction.
GBP/USD: BEARS ENTERED INTO CLOUD
07:17 27.09.2017
Technical levels: support 1.3310, 1.3255; resistance 1. 3560.
Trade recommendations:
Buy 1.3260; SL 1.3240; TP1 1.3440; TP2 1.3560.
Reason: bullish Ichimoku Cloud with falling Senkou Span A; a dead cross of Tenkan-sen and Kijun-sen, with the falling lines; the market entered into the cloudy area and may go lower to the support of Senkou Span B.