Bem vindos ao Fórum do Portal BolsaPT! Inscrevam-se e participem na nossa comunidade, poderão pedir opiniões e Análises Técnicas às vossas acções, colocar dúvidas, aprender, partilhar ideias, ajudar outros, etc. Além das cotações, gráficos, análise técnica interactiva, históricos, terão simulação de carteiras, alarmes, e muito mais virá no futuro. Lembre-se que se pode logar com o seu login CanalForex!
On the daily chart, bulls are trying to catch hold of 0.8810 (50% of the last bullish wave). To counterattack in order to resume the uptrend, they need to conquer resistance at 0.8900. On the other hand, a break of support at 0.8775 will increase the risks of continuation of the decline.
On H1, a break of resistance at 0.8900 will create the potential for the realization of the Dragon pattern. However, for a start bulls have to defend current positions and form a Double bottom.
EUR/USD: PRICE GOING TO TEST 34 MA
09:50 22.09.2017
The 89 Moving Average has acted as support, so we've got a "High Wave" pattern, which pushed the price to the nearest resistance. In this case, the market is likely going to test the 34 MA, which could be a departure point for another upward price movement.
There's a "Shooting Star" at the local high, but this pattern hasn't been confirmed enough. Therefore, we're likely going to have a bearish correction towards the Moving Averages. If a pullback from these lines happens, bulls will probably try to reach the upper "Window".
USD/JPY: "WINDOW" ACTED AS RESISTANCE
09:52 22.09.2017
The upper "Window" has acted as resistance, so we've got a "Shooting Star" pattern, which has been confirmed. However, bulls are likely going to test the "Window" once again in the short term. If we have another pullback from this level, there'll be an opportunity to have a decline towards the Moving Averages.
The 55 Moving Average has acted as support, so we've got a bullish "Harami". Under this circumstance, the market is likely going to rise towards the last high during the day.
EUR/USD: BULLS GOING TO DELIVER WAVE 5
05:19 25.09.2017
There's a possible triangle pattern in wave 4. So, if the price fixates above 6/8 MM Level, bulls are likely going to deliver wave 5. In this case, we should keep an eye on 8/8 MM Level as an intraday target.
2/8 MM Level acted as support, so the triangle may have been ended. Therefore, we're likely going to have an upward impulse in wave [i] in the coming hours. If another pullback from 5/8 MM Level arrives later on, there'll be an opportunity to have a local bearish correction.
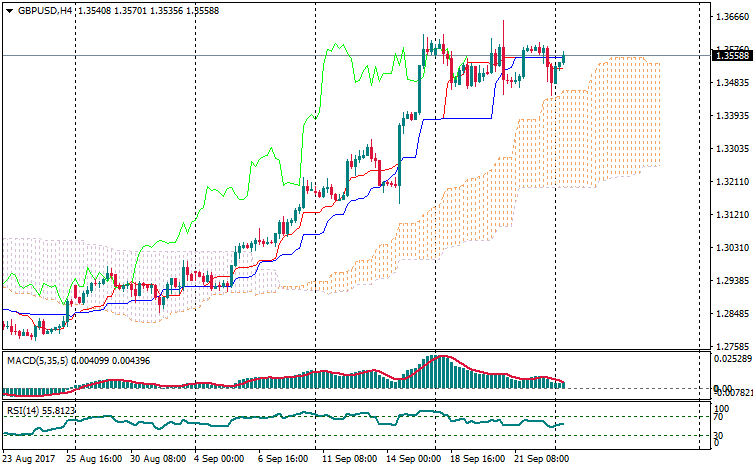
Technical levels: support 1.3520; resistance 1. 3600.
Trade recommendations:
Buy 1.3540/50; SL 1.3520; TP1 1.3650; TP2 1.3700.
Reason: bullish Ichimoku Cloud with rising Senkou Span B; a correctional dead cross of Tenkan-sen and Kijun-sen, the lines are horizontal; the market supported by the Cloud and ready to make the new highs.
AUD/USD: GAME WILL CONTINUE UNDER CLOUD
06:37 25.09.2017
Technical levels: support 0.7930; resistance 0.8000, 0.8040.
Trade recommendations:
Sell 0.7960; SL 0.7980; TP1 0.7900; TP3 0.7870.
Reason: expanding bearish Ichimoku Cloud with falling Senkou Span A; a new dead cross of Tenkan-sen and Kijun-sen; the prices are in the negative area and the bears will continue selling the Aussie.
NZD/USD: BEARS RETURN TO THE GAME
10:23 25.09.2017
Recommendation:
SELL 0.728 SL 0.7335
TP 0.719 TP2 0.7105
TP3 0.705
On the daily chart, the inability of bulls to push the pair above the resistance level at 0.7280 was a signal of their weakness. In case of a break of the lower border of the short-term trend channel, bears will have a chance to form an AB=CD pattern.
On H1, NZD/USD there are pattern Head and Shoulders and Shark. Further dynamics of the pair will depend on bulls ability to keep the pair above support at 0.7185-0.7205. If they fail, triggering of the Widening wedge pattern will allow bears to continue correction.
On the daily chart, AUD/USD triggered Gartley pattern with a target at 78.6%. The necessary condition for its formation is the decline of the pair below support at 0.7937. On the other hand, if bulls manage to return the pair inside the bullish trend channel, a rally towards 161.8% of the AB=CD pattern will continue.
On H1, AUD/USD is forming a Widening wedge pattern. The decline of the pair below 0.7950 will be a signal for correction. Buying is possible from 78.6% and 88.6% of the wave 4-5.
There's a "V-Top" pattern, so a new "Breakaway Gap" was formed this morning. The 89 Moving Average is acting as support, but bears are likely going to test the next support at 1.1837 - 1.1822. If a pullback from this area happens, we could have an upward price movement towards the closest resistance at 1.1909 - 1.1925.
The downward trend has been broken, so the price is still declining. The main bearish target is the nearest support at 1.1837 - 1.1822. If we have a pullback from this area, there'll be an opportunity to have an upward correction in the direction of the closest resistance at 1.1897 - 1.1909.
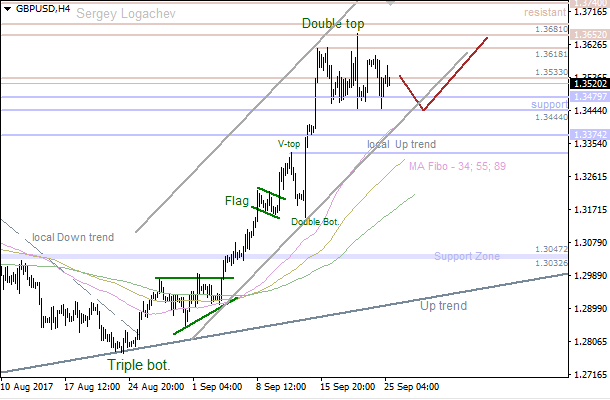
The price is still consolidating between the levels 1.3652 - 1.3444. It seems like bears are going to test the next support at 1.3479 - 1.3444. However, if a pullback from this area happens later on, bulls will probably try to reach the nearest resistance at 1.3618 - 1.3625.
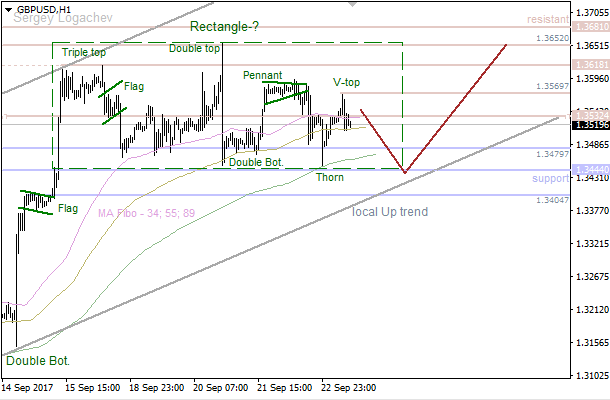
There's a possible developing "Rectangle" pattern, so the price is likely going to achieve the nearest support at 1.3444. Meanwhile, if we have a pullback from this level, we could have a bullish correction towards the closest resistance at 1.3618 - 1.3625.